Learn more how to embed presentation in WordPress

- Slides
- 11 slides
Published Feb 23, 2014 in
Business & Management
Direct Link :
Copy and paste the code below into your blog post or website
Copy URL
Embed into WordPress (learn more)

Comments
comments powered by DisqusPresentation Slides & Transcript
Presentation Slides & Transcript
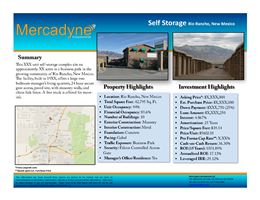
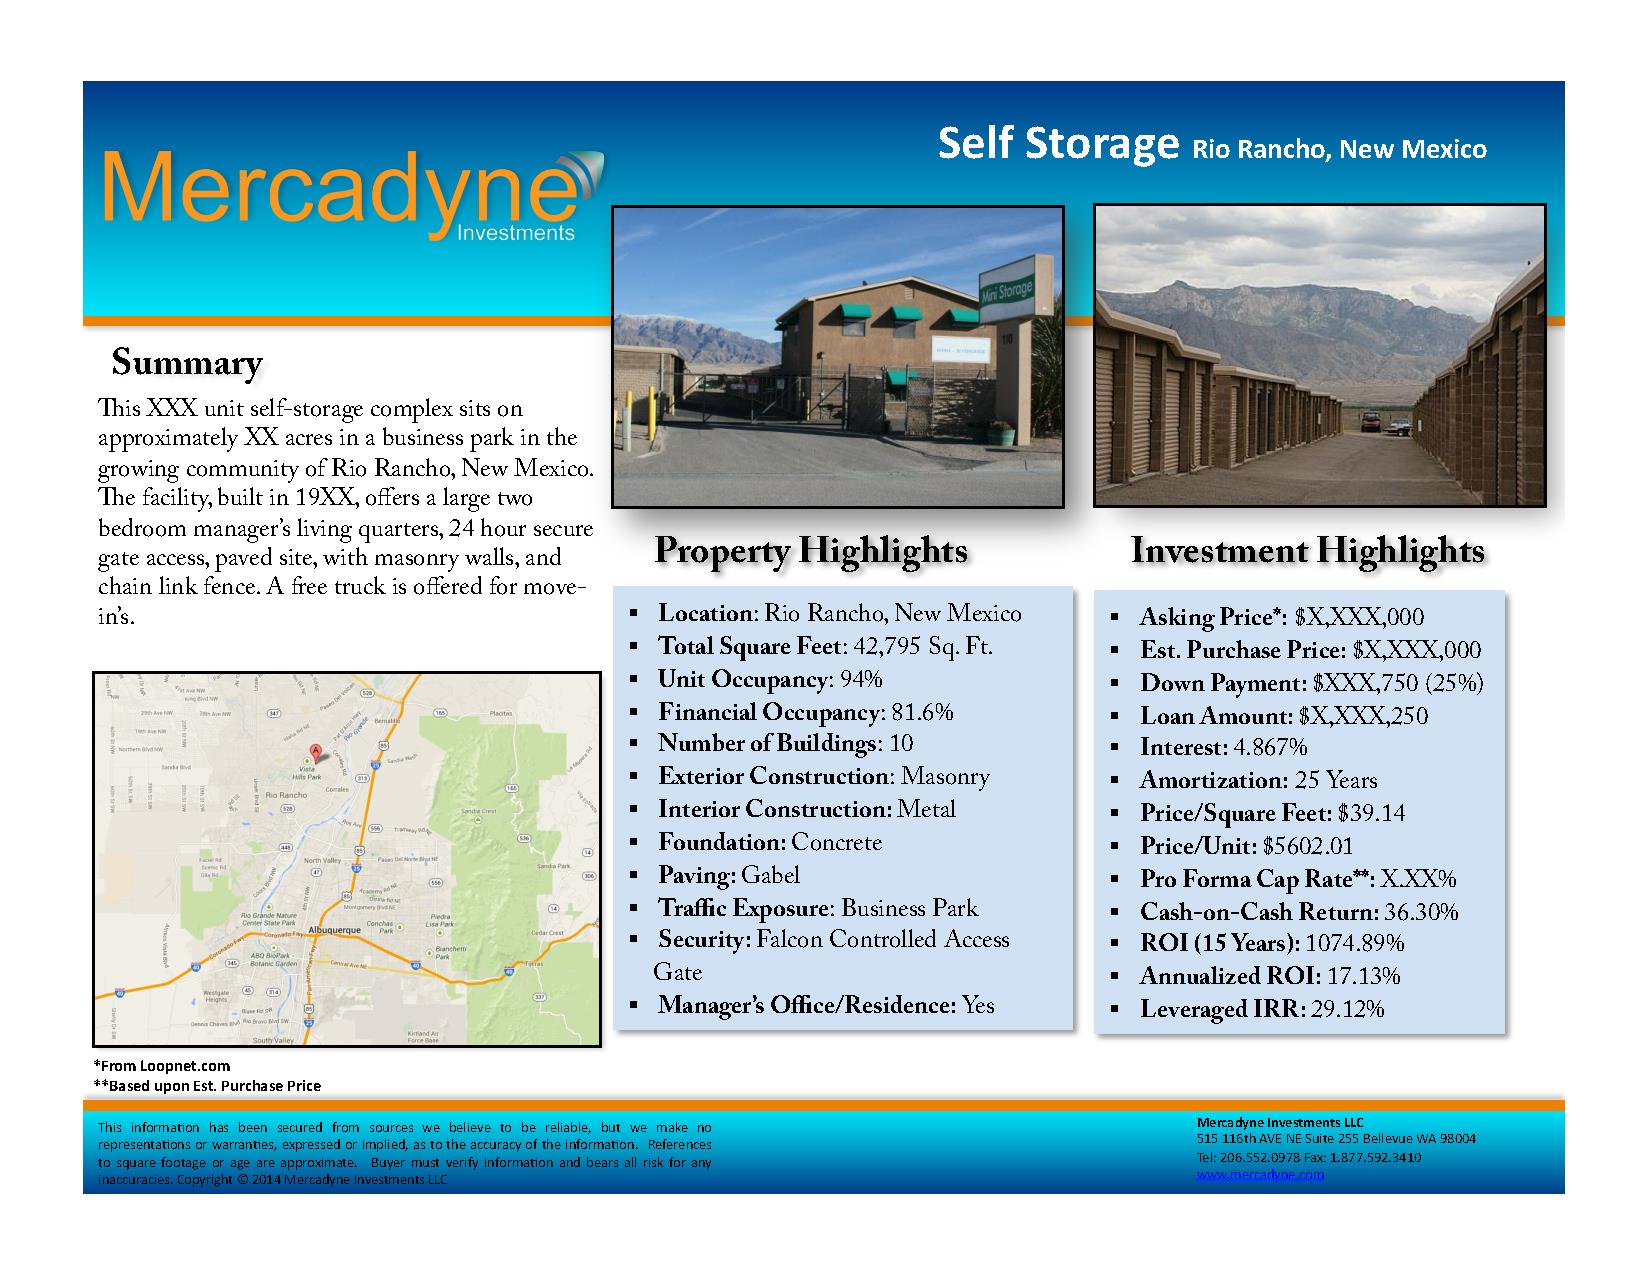
Summary ! is XXX unit self-storage complex sits on approximately XX acres in a business park in the growing community of Rio Rancho, New Mexico. ! e facility, built in 19XX, o" ers a large two bedroom managerÕs living quarters, 24 hour secure gate access, paved site, with masonry walls, and chain link fence. A free truck is o" ered for move- inÕs. !"#$%#&'()*+,(&%"+$%-..&%$./0).1%')(*%$(0)/.$%2.%-.3#.4.%5(%-.%).3#+-3.6%-05%2.%*+7.%&(% ).8).$.&5+,(&$%()%2+))+&,.$6%.98).$$.1%()%#*83#.16%+$%5(%5".%+//0)+/:%('%5".%#&'()*+,(&;%%<.'.).&/.$% 5(%$=0+).%'((5+>.%()%+>.%+).%+88)(9#*+5.;%%?0:.)%*0$5%4.)#':%#&'()*+,(&%+&1%-.+)$%+33%)#$7%'()%+&:% #&+//0)+/#.$;%@(8:)#>"5%A%BCDE%F.)/+1:&.%G&4.$5*.&5$%HH@% !"#$%&'(")*(+",-."(-,)//0) IDI%DDJ5"%KLM%NM%O0#5.%BII%?.33.40.%PK%QRCCE% !.3S%BCJ;IIB;CQTR%U+9S% D;RTT;IQB;VEDC% 222;*.)/+1:&.;/(* % Property Highlights ! ! Location : Rio Rancho, New Mexico ! ! Total Square Feet : 42,795 Sq. Ft. ! ! Unit Occupancy : 94% ! ! Financial Occupancy : 81.6% ! ! Number of Buildings : 10 ! ! Exterior Construction : Masonry ! ! Interior Construction: Metal ! ! Foundation: Concrete ! ! Paving: Gabel ! ! Tra! c Exposure : Business Park ! ! Security: Falcon Controlled Access Gate ! ! ManagerÕs O! ce/Residence: Yes 1"23)1-4#%5") 674)6%($849):";)!"<7$4)) Investment Highlights ! ! Asking Price*: $X,XXX,000 ! ! Est. Purchase Price: $X, XXX ,000 ! ! Down Payment: $XXX,750 (25%) ! ! Loan Amount: $X,XXX,250 ! ! Interest: 4.867% ! ! Amortization: 25 Years ! ! Price/Square Feet: $39.14 ! ! Price/Unit: $5602.01 ! ! Pro Forma Cap Rate**: X . XX % ! ! Cash-on-Cash Return: 36.30% ! ! ROI (15 Years): 1074.89% ! ! Annualized ROI: 17.13% ! ! Leveraged IRR: 29.12% =>#4.) /44?("-@$4. ) ==A%,"&)B?4()C,-@)DB#$8%,")D#7$")
!"#$%#&'()*+,(&%"+$%-..&%$./0).1%')(*%$(0)/.$%2.%-.3#.4.%5(%-.%).3#+-3.6%-05%2.%*+7.%&(% ).8).$.&5+,(&$%()%2+))+&,.$6%.98).$$.1%()%#*83#.16%+$%5(%5".%+//0)+/:%('%5".%#&'()*+,(&;%%<.'.).&/.$% 5(%$=0+).%'((5+>.%()%+>.%+).%+88)(9#*+5.;%%?0:.)%*0$5%4.)#':%#&'()*+,(&%+&1%-.+)$%+33%)#$7%'()%+&:% #&+//0)+/#.$;%@(8:)#>"5%A%BCDE%F.)/+1:&.%G&4.$5*.&5$%HH@% !"#$%&'(")*(+",-."(-,)//0) IDI%DDJ5"%KLM%NM%O0#5.%BII%?.33.40.%PK%QRCCE% !.3S%BCJ;IIB;CQTR%U+9S% D;RTT;IQB;VEDC% 222;*.)/+1:&.;/(* % Demographic Facts Rio Rancho, New Mexico, ÒCity of VisionÓ, is one of the fastest growing communities with the Albuquerque metro area, and in the nation. Rio Rancho is building a national reputation based on its commitment to sustainable economic development; technology based employment; a" ordable housing; a premier public education system; and its ongoing support for quality-of-life initiatives. Relocating retirees, and others seeking quality of life and opportunity have transformed this once bedroom community into the fourth largest city in New Mexico growing at a pace of 20% year to year. Current population as of 2012 is 90,818. Rio Rancho is home to several high tech # rms such as Intel Corporation, Letrosonics, and Xynatech and recently has diversi# ed with the addition of several motion picture # rms, including the New Lionsgate Entertainment Studio & Campus on 52 acres, insuring that Rio Rancho becomes the new motion picture production mecca for the intermountain west . " e City of Rio Rancho Population: 90,818 (2012) Ð 80% rise from 2000 Median Age: 35 years old Median Income for individual: $47,169 Median Income for household: $52,233 Unemployment: 7.3% (Aug 2013) Travel Time: ¥ ! 20 minutes to Journal Center Business District ¥ ! 25 minutes to downtown Albuquerque ¥ ! 30 minutes to uptown # nancial/retail district ¥ ! 30 minutes to Albuquerque International Airport ¥ ! 45 minutes to Santa Fe EF9GHH) GH9IJG) KK9LMH) C1N@ LL9JHM) M) FM9MMM) OM9MMM) JM9MMM) KM9MMM) HMM9MMM) HFM9MMM) HLLM) FMMM) FMHM) FMHG) Rio Rancho Population 1"23)1-4#%5") 674)6%($849):";)!"<7$4))
!"#$%#&'()*+,(&%"+$%-..&%$./0).1%')(*%$(0)/.$%2.%-.3#.4.%5(%-.%).3#+-3.6%-05%2.%*+7.%&(% ).8).$.&5+,(&$%()%2+))+&,.$6%.98).$$.1%()%#*83#.16%+$%5(%5".%+//0)+/:%('%5".%#&'()*+,(&;%%<.'.).&/.$% 5(%$=0+).%'((5+>.%()%+>.%+).%+88)(9#*+5.;%%?0:.)%*0$5%4.)#':%#&'()*+,(&%+&1%-.+)$%+33%)#$7%'()%+&:% #&+//0)+/#.$;%@(8:)#>"5%A%BCDE%F.)/+1:&.%G&4.$5*.&5$%HH@% !"#$%&'(")*(+",-."(-,)//0) IDI%DDJ5"%KLM%NM%O0#5.%BII%?.33.40.%PK%QRCCE% !.3S%BCJ;IIB;CQTR%U+9S% D;RTT;IQB;VEDC% 222;*.)/+1:&.;/(* % 2013 Operating Summary Income Gross Rent $243,434.79 Outside Parking $7,858.67 Late Fees $8,791.77 SRF/Lien Fees $65.45 Admin & Registration $1,745.45 Auction Revenues $2,018.18 Returned Checks ($1,072.95) Refunds ($4,821.95) Other Charges $15.27 Merchandise $849.17 Total Income $258,883.87 Expense Accounting $7,445.45 Advertising & promotion $5,544.27 Bank Charges $252.00 Computers & Internet $573.23 Credit Card Fees $5,033.15 Insurance $4,114.00 License & fees $404.64 Management Fee $32,721.38 Wages, Taxes and Bene# ts $40,097.98 Total Expenses $96,186.11 Net Operating Income $162,697.76 Est. Purchase Price $X,XXX,000 Pro Forma Cap Rate X.XX% At Purchase Post Purchase Potential Gross Rent $XXX,468 $XXX,752 Less Vacancy and Concession 15% $XX,420 $XX,813 Potential Net Rental Income $XXX,048 $XXX,939 Potential Increase Rental Income Units Size Rates Total Sq. Ft. Total Rent Rent/Sq. Ft. 62 5x10 $47 3,100 $2,914 $0.94 66 10x10 $70 6,600 $4,620 $0.70 21 10x12 $80 2,520 $1,680 $0.67 34 10x15 $90 5,100 $3,060 $0.60 21 10x18 $96 3,780 $2,016 $0.53 38 10x20 $110 7,600 $4,180 $0.55 43 10x30 $145 12,900 $6,235 $0.48 Current Unit Mix And Rent Schedule RV & Boat Units Rates Total Boat 16 $45 $720 RV 7 $52 $364 Mix Unit Income Percentages DDW% DRW% TW% DBW% RW% DJW% BEW% VW% DW% I9DC% DC9DC% DC9DB% DC9DI% DC9DR% DC9BC% DC9VC% ?(+5%
!"#$%#&'()*+,(&%"+$%-..&%$./0).1%')(*%$(0)/.$%2.%-.3#.4.%5(%-.%).3#+-3.6%-05%2.%*+7.%&(% ).8).$.&5+,(&$%()%2+))+&,.$6%.98).$$.1%()%#*83#.16%+$%5(%5".%+//0)+/:%('%5".%#&'()*+,(&;%%<.'.).&/.$% 5(%$=0+).%'((5+>.%()%+>.%+).%+88)(9#*+5.;%%?0:.)%*0$5%4.)#':%#&'()*+,(&%+&1%-.+)$%+33%)#$7%'()%+&:% #&+//0)+/#.$;%@(8:)#>"5%A%BCDE%F.)/+1:&.%G&4.$5*.&5$%HH@% !"#$%&'(")*(+",-."(-,)//0) IDI%DDJ5"%KLM%NM%O0#5.%BII%?.33.40.%PK%QRCCE% !.3S%BCJ;IIB;CQTR%U+9S% D;RTT;IQB;VEDC% 222;*.)/+1:&.;/(* % DT;BCW% DC;DCW% E;ECW% DB;VCW% J;CCW% C;CCW% B;CCW% E;CCW% J;CCW% R;CCW% DC;CCW% DB;CCW% DE;CCW% DJ;CCW% DR;CCW% BC;CCW% BCCQ% BCDC% BCDD% BCDB% BCDV% Physical Vacancy DE;VCW% T;ICW% E;ICW% DD;ECW% I;TCW% C;CCW% B;CCW% E;CCW% J;CCW% R;CCW% DC;CCW% DB;CCW% DE;CCW% DJ;CCW% BCCQ% BCDC% BCDD% BCDB% BCDV% Financial Vacancy Vacancy Rates 1"23)1-4#%5") 674)6%($849):";)!"<7$4))
!"#$%#&'()*+,(&%"+$%-..&%$./0).1%')(*%$(0)/.$%2.%-.3#.4.%5(%-.%).3#+-3.6%-05%2.%*+7.%&(% ).8).$.&5+,(&$%()%2+))+&,.$6%.98).$$.1%()%#*83#.16%+$%5(%5".%+//0)+/:%('%5".%#&'()*+,(&;%%<.'.).&/.$% 5(%$=0+).%'((5+>.%()%+>.%+).%+88)(9#*+5.;%%?0:.)%*0$5%4.)#':%#&'()*+,(&%+&1%-.+)$%+33%)#$7%'()%+&:% #&+//0)+/#.$;%@(8:)#>"5%A%BCDE%F.)/+1:&.%G&4.$5*.&5$%HH@% !"#$%&'(")*(+",-."(-,)//0) IDI%DDJ5"%KLM%NM%O0#5.%BII%?.33.40.%PK%QRCCE% !.3S%BCJ;IIB;CQTR%U+9S% D;RTT;IQB;VEDC% 222;*.)/+1:&.;/(* % Year 1 Year 2 Year 3 Year 4 Year 5 Year 6 Year 7 Year 8 Year 9 Year 10 Year 11 Year 12 Year 13 Year 14 Year 15 Totals Income $266,650 $274,650 $282,889 $291,376 $300,117 $309,121 $318,395 $327,946 $337,785 $347,918 $358,356 $369,106 $380,180 $391,585 $403,333 $4,959,407 Expenses Accounting $7,632 $7,822 $8,018 $8,218 $8,424 $8,634 $8,850 $9,072 $9,298 $9,531 $9,769 $10,013 $10,264 $10,520 $10,783 $136,849 On Site Automated Management $20,500 $21,013 $21,538 $22,076 $22,628 $23,194 $23,774 $24,368 $24,977 $25,602 $26,242 $26,898 $27,570 $28,259 $28,966 $367,604 O ! Site Management $13,333 $13,732 $14,144 $14,569 $15,006 $15,456 $15,920 $16,397 $16,889 $17,396 $17,918 $18,455 $19,009 $19,579 $20,167 $247,970 Advertising & Promotion $5,683 $5,825 $5,971 $6,120 $6,273 $6,430 $6,590 $6,755 $6,924 $7,097 $7,275 $7,456 $7,643 $7,834 $8,030 $101,905 Bank Charges $258 $265 $271 $278 $285 $292 $300 $307 $315 $323 $331 $339 $347 $356 $365 $4,632 Computer & Internet $588 $602 $617 $633 $649 $665 $681 $698 $716 $734 $752 $771 $790 $810 $830 $10,536 Credit Card Fees $5,159 $5,288 $5,420 $5,556 $5,695 $5,837 $5,983 $6,132 $6,286 $6,443 $6,604 $6,769 $6,938 $7,112 $7,290 $92,510 Insurance $4,217 $4,322 $4,430 $4,541 $4,655 $4,771 $4,890 $5,013 $5,138 $5,266 $5,398 $5,533 $5,671 $5,813 $5,958 $75,616 License & Fee $415 $425 $436 $447 $458 $469 $481 $493 $505 $518 $531 $544 $558 $572 $586 $7,437 Wages, Taxes and Bene" ts $10,024 $10,275 $10,532 $10,795 $11,065 $11,342 $11,625 $11,916 $12,214 $12,519 $12,832 $13,153 $13,482 $13,819 $14,164 $179,759 Total Expenses $67,808 $69,570 $71,378 $73,233 $75,137 $77,090 $79,095 $81,151 $83,262 $85,428 $87,651 $89,932 $92,272 $94,674 $97,139 $1,224,819 Net Operating Income $198,842 $205,080 $211,512 $218,143 $224,981 $232,031 $239,300 $246,795 $254,522 $262,490 $270,705 $279,175 $287,907 $296,911 $306,194 $3,734,588 Debt Service $93,453 $93,453 $93,453 $93,453 $93,453 $93,453 $93,453 $93,453 $93,453 $93,453 $93,453 $93,453 $93,453 $93,453 $93,453 $1,401,788 Net Cash Flow Before Tax After Debt Service $105,390 $111,628 $118,059 $124,691 $131,528 $138,578 $145,847 $153,342 $161,070 $169,038 $177,252 $185,722 $194,455 $203,458 $212,741 $2,332,800 Cash-on-Cash Return 24.80% 26.27% 27.79% 29.35% 30.96% 32.62% 34.33% 36.09% 37.91% 39.79% 41.72% 43.71% 45.77% 47.89% 50.07% 36.60% 15-Year Pro Forma Financial Projection (2014 Ð 2028) M@MMP) HM@MMP) FM@MMP) EM@MMP) OM@MMP) GM@MMP) JM@MMP) QM)) QGM9MMM)) QHMM9MMM)) QHGM9MMM)) QFMM9MMM)) QFGM9MMM)) R"%#)H) R"%#)F) R"%#)E) R"%#)O) R"%#)G) R"%#)J) R"%#)I) R"%#)K) R"%#)L) R"%#)HM) R"%#)HH) R"%#)HF) R"%#)HE) R"%#)HO) R"%#)HG) :"-)0%,8)>24;)A"34#")N%<)ST"#)U"V-)1"#+7$") 0%,8W4(W0%,8)6"-B#() S+"#%5")0%,8WX(W0%,8)6"-B#() EJ@JMP) 1"23)1-4#%5") 674)6%($849):";)!"<7$4))
!"#$%#&'()*+,(&%"+$%-..&%$./0).1%')(*%$(0)/.$%2.%-.3#.4.%5(%-.%).3#+-3.6%-05%2.%*+7.%&(% ).8).$.&5+,(&$%()%2+))+&,.$6%.98).$$.1%()%#*83#.16%+$%5(%5".%+//0)+/:%('%5".%#&'()*+,(&;%%<.'.).&/.$% 5(%$=0+).%'((5+>.%()%+>.%+).%+88)(9#*+5.;%%?0:.)%*0$5%4.)#':%#&'()*+,(&%+&1%-.+)$%+33%)#$7%'()%+&:% #&+//0)+/#.$;%@(8:)#>"5%A%BCDE%F.)/+1:&.%G&4.$5*.&5$%HH@% !"#$%&'(")*(+",-."(-,)//0) IDI%DDJ5"%KLM%NM%O0#5.%BII%?.33.40.%PK%QRCCE% !.3S%BCJ;IIB;CQTR%U+9S% D;RTT;IQB;VEDC% 222;*.)/+1:&.;/(* % Return Enhancement QM)) QH9MMM9MMM)) QF9MMM9MMM)) QE9MMM9MMM)) QO9MMM9MMM)) QG9MMM9MMM)) :"-)$%,8) Y4;) :"-),%2",) *($4.") N4-%2) D#4$""&,) QF9EEF9KMM)) QF9FEH9JOI)) QO9GJO9OOK)) QH9IKL9JLI)) QH9IJL9OLJ)) QE9GGL9HLE)) Financing Terms End of 15 Years Financial at Purchase Financials Post Purchase Financing Terms Sale Price $X,X00,000 $X,X75,000 Loan Amount $X,XX0,000 $X,XX6,250 Down Payment: $X50,000 $X18,750 Closing Costs $13,500 $12,563 Total Investment $X63,500 $X31,313 15-Year Holding Net cash $ ow $1,789,697 $2,332,800 Net sales Income $1,769,496 $2,221,387 Total Proceeds $3,559,193 $4,554,187 Cost of Investment ($463,500) ($424,875) Return on Investment 767.90% 1071.89% Annualized Return on Investment 14.56% 17.13% Average Return on Equity 13.14% 16.40% Unleveraged IRR 7.49% 11.13% Leveraged IRR 19.96% 28.71% Sale Proceeds End of Year 15 Terminal CAP - 10% $2,640,265 $3,061,937 Less Cost of Sale - 5% ($132,013) ($153,097) Sale Proceeds: $2,508,251 $2,908,840 Loan Payo" ($738,755) ($687,453) Net Sales Proceeds $1,769,496 $2,221,387 M@MMP) G@MMP) HM@MMP) HG@MMP) FM@MMP) FG@MMP) EM@MMP) S((B%27Z"&) 6X*) S+"#%5")6XC) [(2"+"#%5"&) *66) /"+"#%5"&) *66) HI@HEP) HJ@OMP) HH@HEP) FK@IHP) HO@GJP) HE@HOP) I@OLP) HL@LJP) QM)) QFMM9MMM)) QOMM9MMM)) QJMM9MMM)) QKMM9MMM)) QH9MMM9MMM)) QH9FMM9MMM)) QH9OMM9MMM)) QH9JMM9MMM)) QH9KMM9MMM)) 1%2")D#7$") /4%() S.4B(-) U4;() D%'."(-\) N4-%2) *(+",-."(-) ]9]]]) ]9]]]) QOHK9IGM)) QOEH9EHE)) ]9]]]) QH9EGM9MMM)) QOGM9MMM)) QOJE9GMM)) S-)DB#$8%,") D4,-)DB#$8%,") Return Ratios 1"23)1-4#%5") 674)6%($849):";)!"<7$4))
!"#$%#&'()*+,(&%"+$%-..&%$./0).1%')(*%$(0)/.$%2.%-.3#.4.%5(%-.%).3#+-3.6%-05%2.%*+7.%&(% ).8).$.&5+,(&$%()%2+))+&,.$6%.98).$$.1%()%#*83#.16%+$%5(%5".%+//0)+/:%('%5".%#&'()*+,(&;%%<.'.).&/.$% 5(%$=0+).%'((5+>.%()%+>.%+).%+88)(9#*+5.;%%?0:.)%*0$5%4.)#':%#&'()*+,(&%+&1%-.+)$%+33%)#$7%'()%+&:% #&+//0)+/#.$;%@(8:)#>"5%A%BCDE%F.)/+1:&.%G&4.$5*.&5$%HH@% !"#$%&'(")*(+",-."(-,)//0) IDI%DDJ5"%KLM%NM%O0#5.%BII%?.33.40.%PK%QRCCE% !.3S%BCJ;IIB;CQTR%U+9S% D;RTT;IQB;VEDC% 222;*.)/+1:&.;/(* % Year 1: 2014 Year 7: 2020 Year 4: 2017 ¥ ! Asset Value: $X,X10,454 ¥ ! Loan Balance: $1,142,480 ¥ ! Equity Value: $767,974 ¥ ! Equity Available for Distribution: $575,980 Equity Available For Distribution Assumptions: ¥ ! Asset Value Growth: 1.5% Annually ¥ ! Re-Financing : 75% LTV 1"23)1-4#%5") 674)6%($849):";)!"<7$4)) ¥ ! Asset Value: $X,997,721 ¥ ! Loan Balance: $X,041,411 ¥ ! Equity Value: $956,310 ¥ ! Equity Available for Distribution: $717,232 ¥ ! Initial Investment: $700,000 ¥ ! Asset Value: $X,X00,000 ¥ ! Loan Amount: $X,X56,250 ¥ ! Amortization: 25 years
!"#$%#&'()*+,(&%"+$%-..&%$./0).1%')(*%$(0)/.$%2.%-.3#.4.%5(%-.%).3#+-3.6%-05%2.%*+7.%&(% ).8).$.&5+,(&$%()%2+))+&,.$6%.98).$$.1%()%#*83#.16%+$%5(%5".%+//0)+/:%('%5".%#&'()*+,(&;%%<.'.).&/.$% 5(%$=0+).%'((5+>.%()%+>.%+).%+88)(9#*+5.;%%?0:.)%*0$5%4.)#':%#&'()*+,(&%+&1%-.+)$%+33%)#$7%'()%+&:% #&+//0)+/#.$;%@(8:)#>"5%A%BCDE%F.)/+1:&.%G&4.$5*.&5$%HH@% !"#$%&'(")*(+",-."(-,)//0) IDI%DDJ5"%KLM%NM%O0#5.%BII%?.33.40.%PK%QRCCE% !.3S%BCJ;IIB;CQTR%U+9S% D;RTT;IQB;VEDC% 222;*.)/+1:&.;/(* % Sale Comparables Juan Tabo Self Storage 1777 % Juan Tabo Blvd NE Albuquerque, NM Asking Price $1,900,000 Rentable SF 28,516 Price/SF $66.63 NOI $171,000 Cap Rate 9.00% Built Year 1977 Subject Self Storage Rio Ranch, NM Asking Price $X,X00,000 Rentable SF 42,795 Price/SF $42.06 NOI $162,698 Cap Rate X.71% Built Year 1995 Aardvark Self Storage 4036 % Cerrillos Rd Santa Fe, NM Asking Price $1,075,000 Rentable SF 32,032 Price/SF $33.56 NOI $99,975 Cap Rate 9.30% Built Year 1980 North Coors Self Storage 615b Coors Blvd. NW Albuquerque, NM 87121 O " ering Price $1,800,000 Rentable SF 24,960 Price/SF $72.12 NOI $155,220 Cap Rate 8.24% Built Year 2007 1"23)1-4#%5") 674)6%($849):";)!"<7$4))
XC;CC% XDC;CC% XBC;CC% XVC;CC% XEC;CC% XIC;CC% XJC;CC% XTC;CC% XRC;CC% K4.)+>.% <#4.)Y$% M1>.% Z0+&% !+-(% K+)14+)7% N()5"% @(()$% !"#$%#&'()*+,(&%"+$%-..&%$./0).1%')(*%$(0)/.$%2.%-.3#.4.%5(%-.%).3#+-3.6%-05%2.%*+7.%&(% ).8).$.&5+,(&$%()%2+))+&,.$6%.98).$$.1%()%#*83#.16%+$%5(%5".%+//0)+/:%('%5".%#&'()*+,(&;%%<.'.).&/.$% 5(%$=0+).%'((5+>.%()%+>.%+).%+88)(9#*+5.;%%?0:.)%*0$5%4.)#':%#&'()*+,(&%+&1%-.+)$%+33%)#$7%'()%+&:% #&+//0)+/#.$;%@(8:)#>"5%A%BCDE%F.)/+1:&.%G&4.$5*.&5$%HH@% !"#$%&'(")*(+",-."(-,)//0) IDI%DDJ5"%KLM%NM%O0#5.%BII%?.33.40.%PK%QRCCE% !.3S%BCJ;IIB;CQTR%U+9S% D;RTT;IQB;VEDC% 222;*.)/+1:&.;/(* % Comparables Geography Price/Square Feet Cap Rates T;ICW% R;CCW% R;ICW% Q;CCW% Q;ICW% DC;CCW% K4.)+>.% <#4.)Y$% M1>.% Z0+&% !+-(% K+)14+)7% N()5"% @(()$% Comparables Analysis 1"23)1-4#%5") 674)6%($849):";)!"<7$4))
!"#$%#&'()*+,(&%"+$%-..&%$./0).1%')(*%$(0)/.$%2.%-.3#.4.%5(%-.%).3#+-3.6%-05%2.%*+7.%&(% ).8).$.&5+,(&$%()%2+))+&,.$6%.98).$$.1%()%#*83#.16%+$%5(%5".%+//0)+/:%('%5".%#&'()*+,(&;%%<.'.).&/.$% 5(%$=0+).%'((5+>.%()%+>.%+).%+88)(9#*+5.;%%?0:.)%*0$5%4.)#':%#&'()*+,(&%+&1%-.+)$%+33%)#$7%'()%+&:% #&+//0)+/#.$;%@(8:)#>"5%A%BCDE%F.)/+1:&.%G&4.$5*.&5$%HH@% !"#$%&'(")*(+",-."(-,)//0) IDI%DDJ5"%KLM%NM%O0#5.%BII%?.33.40.%PK%QRCCE% !.3S%BCJ;IIB;CQTR%U+9S% D;RTT;IQB;VEDC% 222;*.)/+1:&.;/(* % World Wide Web Call Center ¥ ! Provide clients reliable support 24/7 ¥ ! Answer questions, adjust client account, enter payments, and make reservations Clients ¥ ! Make reservations on line ¥ ! Create new accounts online ¥ ! Make online payments ¥ ! View payment histories ¥ ! Change contact pro# les ¥ ! Set up automatic billing ¥ ! Email site managers Automated Management System Central Management ¥ ! Instant access to data, transaction, rate structure from anywhere ¥ ! View all activities in real time from anywhere ¥ ! Automatically create letters and reports for managers, clients, accountants and investors. ¥ ! Reduce Operating Costs ¥ ! Optimize Management E ! ciency ¥ ! Minimize Human Resource Participation ¥ ! Increase NOI and Cash Flow ¥ ! Increase ROE, IRR and Cash-On-Cash Return, ¥ ! Enhance Asset Value and Shareholder Value 1"23)1-4#%5") 674)6%($849):";)!"<7$4))
R apid Growing Business with Underlying Asset Value " at Are Highly Susceptible to Automation, To Reduce Operating Costs E xtremely Capable and Forward " inking Management Team A sset Acquisition " at Provides Immediate Cash Flow And Recurring Revenue R eplicable Strategy to Build Signi# cant Portfolio of Assets !"#$%#&'()*+,(&%"+$%-..&%$./0).1%')(*%$(0)/.$%2.%-.3#.4.%5(%-.%).3#+-3.6%-05%2.%*+7.%&(% ).8).$.&5+,(&$%()%2+))+&,.$6%.98).$$.1%()%#*83#.16%+$%5(%5".%+//0)+/:%('%5".%#&'()*+,(&;%%<.'.).&/.$% 5(%$=0+).%'((5+>.%()%+>.%+).%+88)(9#*+5.;%%?0:.)%*0$5%4.)#':%#&'()*+,(&%+&1%-.+)$%+33%)#$7%'()%+&:% #&+//0)+/#.$;%@(8:)#>"5%A%BCDE%F.)/+1:&.%G&4.$5*.&5$%HH@% !"#$%&'(")*(+",-."(-,)//0) IDI%DDJ5"%KLM%NM%O0#5.%BII%?.33.40.%PK%QRCCE% !.3S%BCJ;IIB;CQTR%U+9S% D;RTT;IQB;VEDC% 222;*.)/+1:&.;/(* % P urchase Undervalued Self- Storage Business Where Management Participation Can Materially Improve Operating Results Reasons To Invest 1"23)1-4#%5") 674)6%($849):";)!"<7$4))